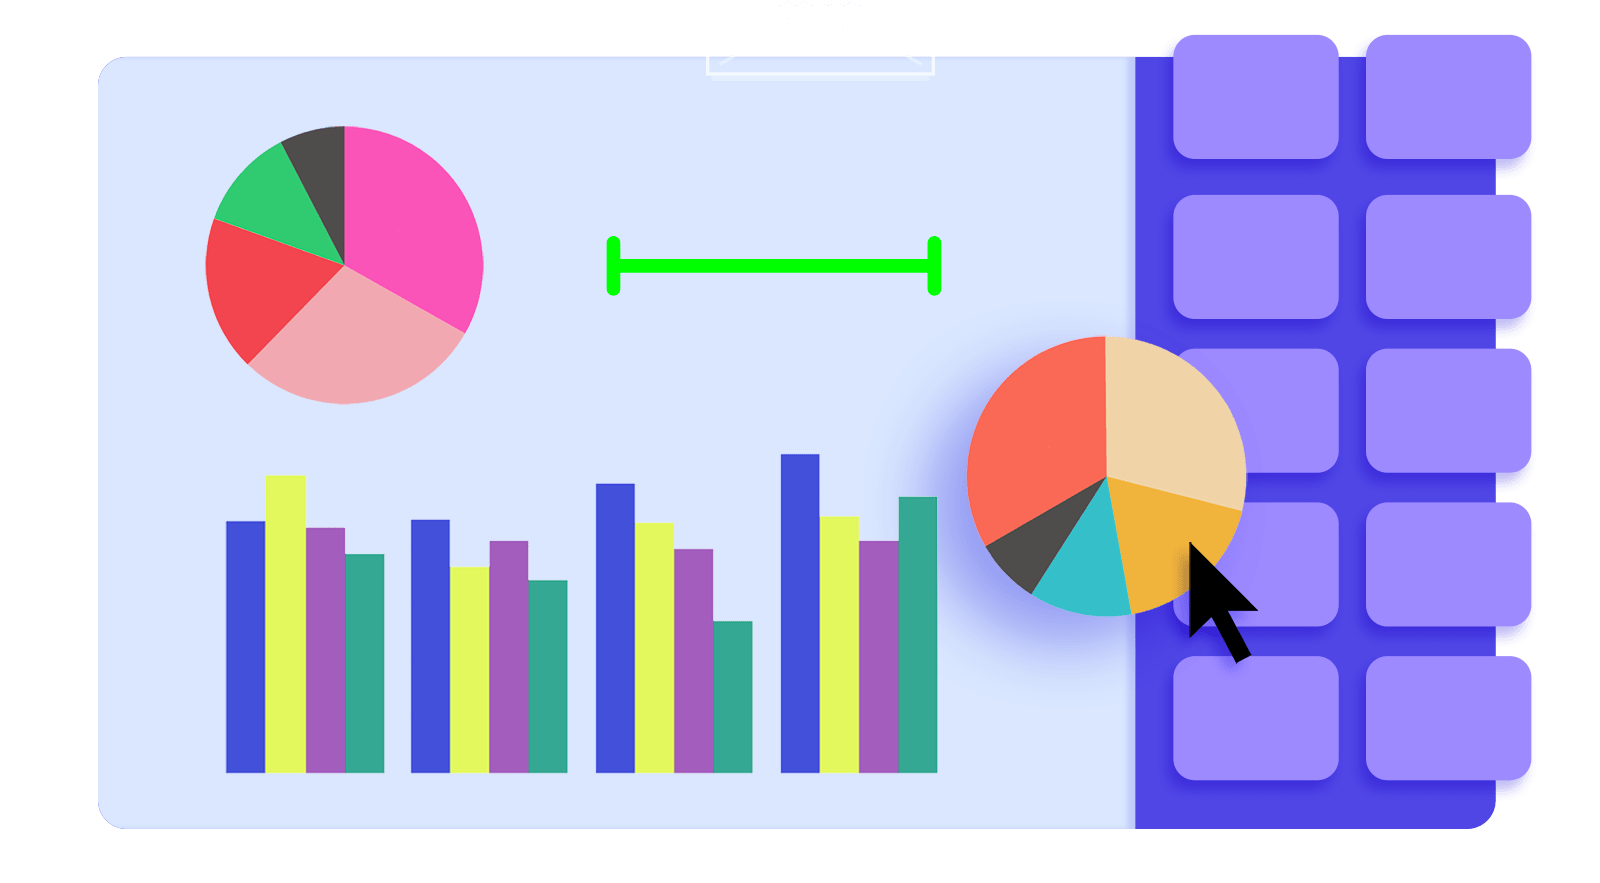
Transform your data into visually compelling charts and graphs that make it easy for your audience to grasp key insights and understand your impact.

Choose from a variety of chart and graph styles. Simplify complex data with clear visual representations.
Customize the look and feel to match your brand while making data-driven storytelling more accessible and engaging.
format_quote{{quotes[env.quote_index].title}}
{{quotes[env.quote_index].text}}