By Dionna Dash
Personalizing a report makes your content more relevant to each donor. And with relevancy, they usually feel more valued and more connected to your cause.
Now, personalization can be tricky. So often, report builder tools have trouble integrating data from a CRM (Customer Relationship Management) like Salesforce or Blackbaud into your report builder, and not all report builders support integrations from every CRM.
We eliminated this pain point with our integration features in Storyraise Reports, which supports all CRMs.
Step #1: Integrate your CRM data into Storyraise
To start integrating your CRM data into Storyraise:
1️⃣ Log in to your Storyraise account.
2️⃣ Once you’re in the report builder, go to the “Constituents” tab on the left side menu.
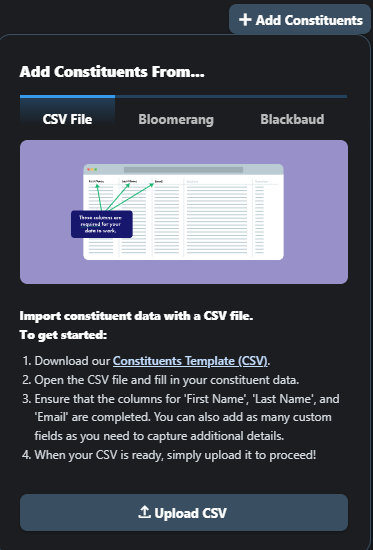
3️⃣ Click “Add Constituents” and a window will pop up with three options:
➡️ Integrating from a CSV
➡️ Bloomerang
➡️ Blackbaud
If you don’t see your CRM, export your data from your CRM as a CSV file and then use the CSV integration option in the report builder.
How to integrate data from a CSV
1️⃣ To integrate data from a CSV file, download Storyraise’s Constituents Template. (This file provides an outline of the constituent data that you’ll want to enter into the report builder.)
2️⃣ Fill out the “First Name,” “Last Name” and “Email” columns. You can also add as many custom fields as you need to capture additional details.
3️⃣ When your CSV is ready, upload it to proceed.
How to integrate data from Bloomerang
1️⃣ To integrate from Bloomerang, paste your API key into the report builder to automatically connect with your constituents.
Not sure where to find your API key? Read this article from Bloomerang.
How to integrate data from Blackbaud
1️⃣ To integrate from Blackbaud, log in to your Blackbaud account in the report builder.
2️⃣ Click the “Connect to Blackbaud” button. You’ll be prompted to enter your login information.
Step #2: Edit your data
You can add constituent data from any mix of these three options, including from multiple and separate CSV files. Once connected, your data fields will populate for each constituent.
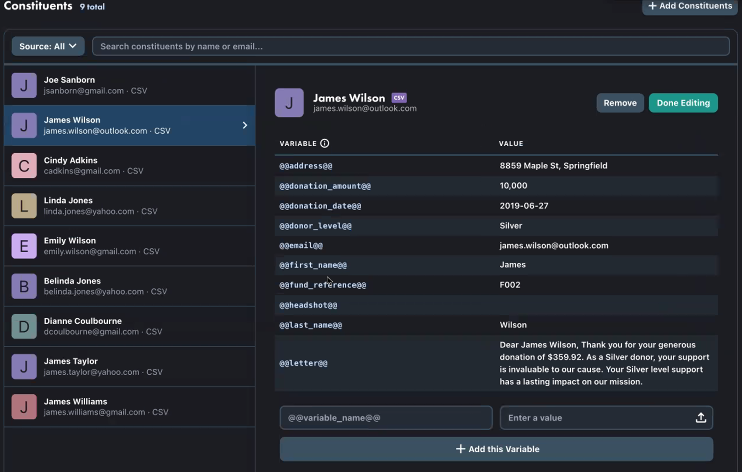
If you need to edit the data you imported from a CSV file:
1️⃣ Select the constituent you want to edit and hover over the variable you want to change.
2️⃣ To add a variable, fill in the “@@variable_name@@” and “Enter a value” fields at the bottom of the constituent profile.
3️⃣ Then click “Add this Variable.”
To edit or add variables to constituents imported from Bloomerang or Blackbaud, make those changes directly in the Bloomerang or Blackbaud platforms.
Step #3: Use your data to personalize reports
Now that your constituent data is integrated, it’s time to use it to personalize your reports. There are two easy ways to do so:
1️⃣ Typing variable tags as plain text
Use this method to autopopulate the desired information (ex. first names and giving levels) into a specific line of text in the report. For example, if you want to add a constituent’s first name to the cover of your report, type “Prepared for @@first_name@@” and that name will populate.

2️⃣ Conditionalizing report content
To provide different donors with different content based on giving levels, interests or other data, use this method of conditionalizing report sections. You can create multiple sections in the same report and conditionalize them so that only certain donors see certain sections.
To do so:
➡️ Click on the section you want to conditionalize
➡️ Navigate to the “Personalize” tab in the right side menu
➡️ Scroll to the “Show When” section
➡️ Enter the appropriate information for “Variable,” “Select Condition” and “Enter Variable Values”
For example, if you only want silver level donors to see a certain beneficiary story, you can enter “Donor_level” for “Variable,” “is” for “Select Condition,” and “Silver” for “Enter Variable Values.”

See these variable data tags and conditionalization in action by previewing a report as Emily, a bronze level donor, or James, a gold level donor.
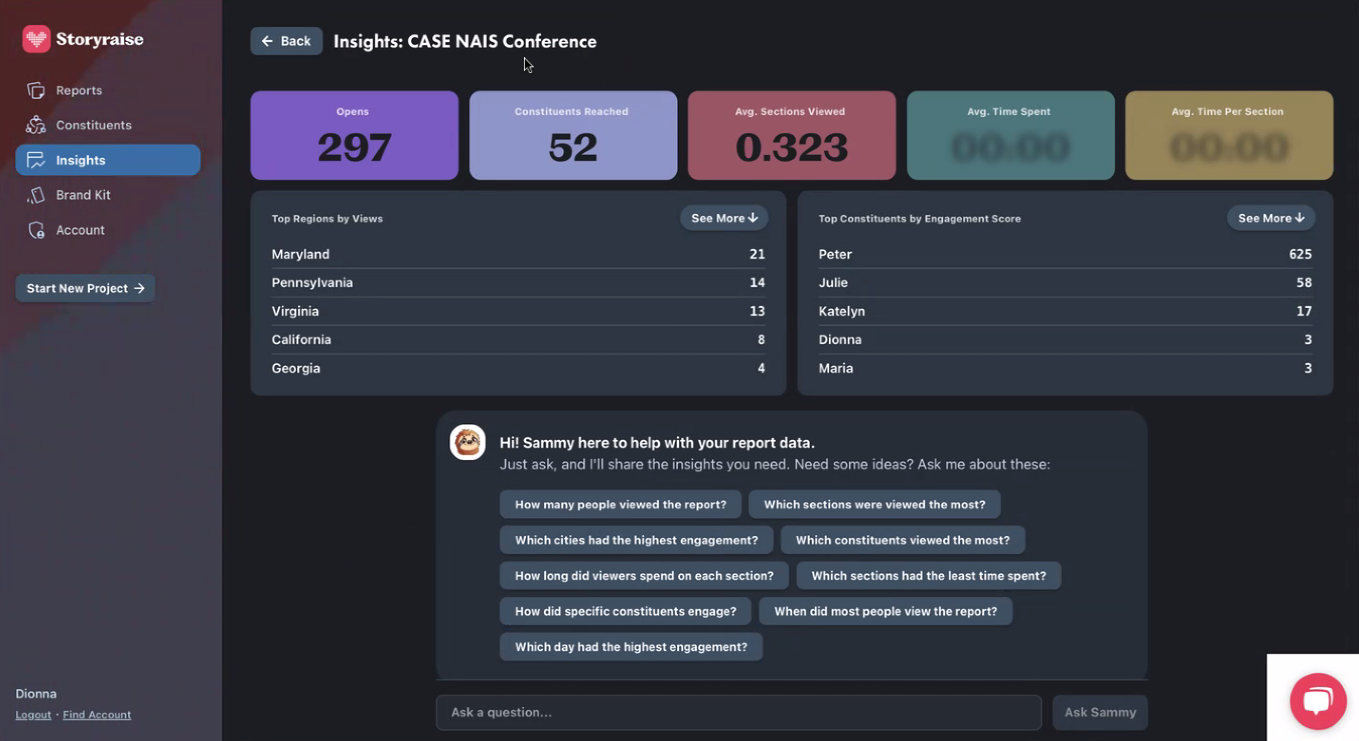
Step #4: View your results to see how personalization bumped donor engagement
Once you’ve sent a report to your integrated constituents, you can head over to the Storyraise Insights section of the report builder and ask Sammy the Sloth, our mascot, for metrics about your constituents, either as individuals or as a whole.